Key Libraries Employed
Data Processing & Cleaning
Pandas, Numpy, Duckdb
Exploratory & Evaluative Data Visualizations
Matplotlib, Seaborn, Folium, Folium.plugins
Regressions and OLS Tables
Scikit-Learn, Statsmodels
65000+ Data Points, 300+ Lines of Code, 58 Pages.
All in One
Data Cleaning
- We employ Pandas, NumPy, and DuckDB to process 65000+ datapoints.

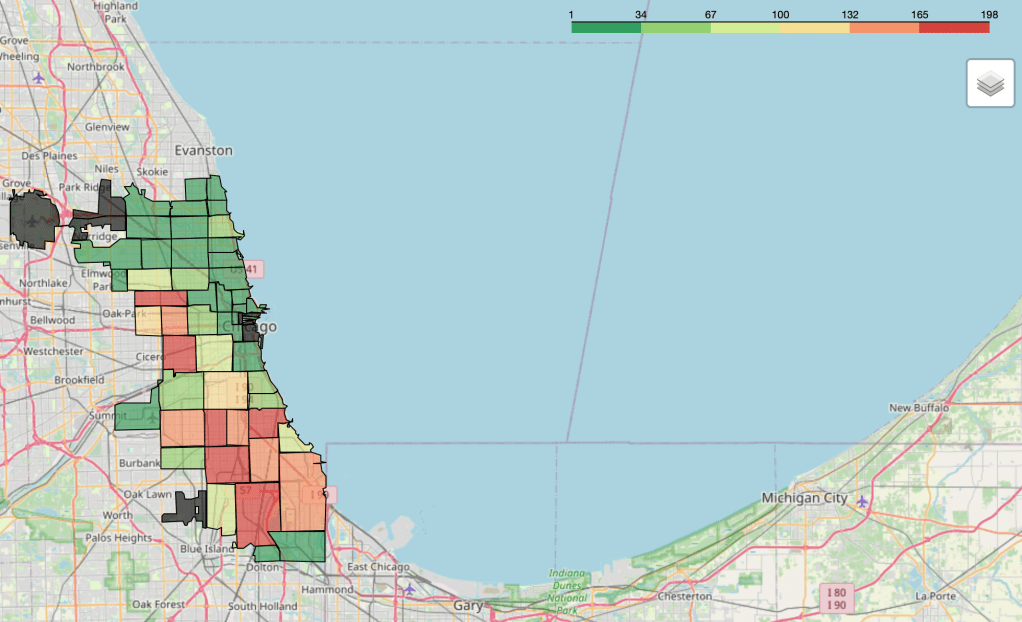
Exploratory Data Analysis
- We employ Folium, a library built on Leaflet.js, to explore whether certain zip codes in Chicago experience higher rates of gunshot violence.
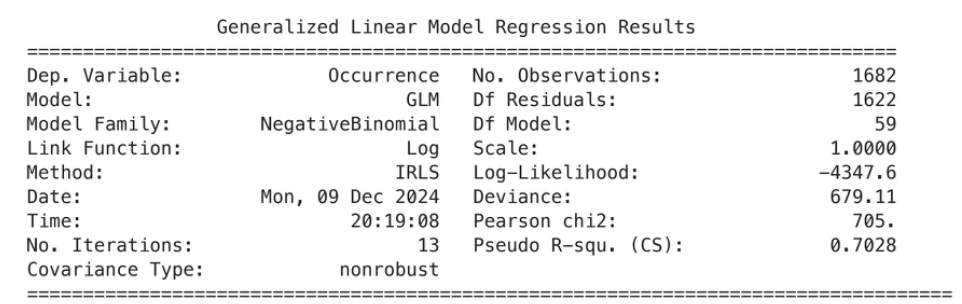
Subquestion I – Is there a significant interplay between race, age, zip code, educational attainment, and one’s likelihood of experiencing gun violence?
- We use a Negative Binomial Generalized Linear Model
- We note the model to be statistically significant, therefore showing significant interplay.
- Lower ages, specific zip codes, and specific races increase one’s chances of experiencing gun violence significantly.

Subquestion II – Do occurrences of gunshot violence vary by month?
- We use one-hot encoding to create binary indicators for month.
- We note that, in most cases, month coefficients are significant in explaining gunshot violence, and 78% of the variation in the data can be explained by the model with an MSE of 0.001.
- July has the highest occurrence of gunshot violence.
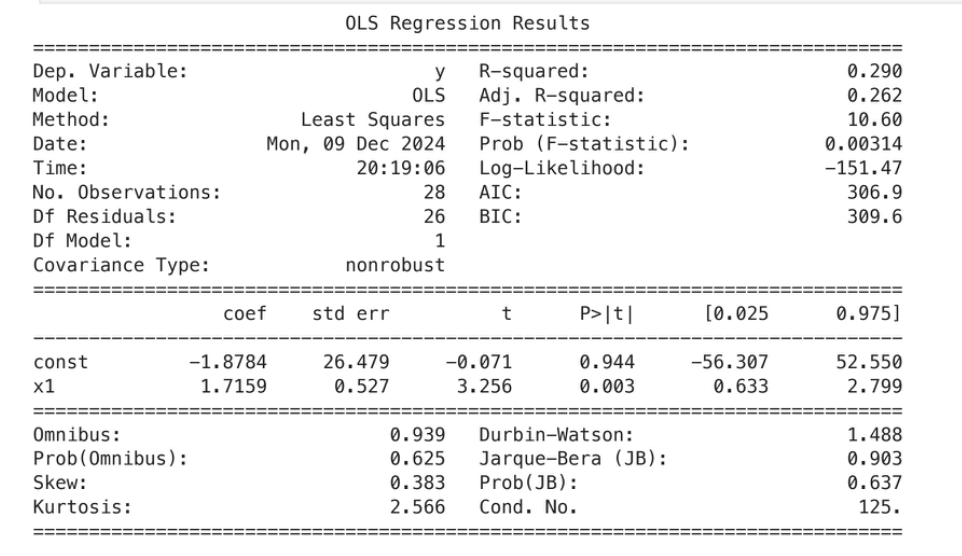
Subquestion III – Do average test scores by zip code correlate with gunshot violence in that zip code?
- We create a relative ranking of Chicago zip codes based on average standardized test scores.
- We note a fairly low R Squared statistic but a significant model test statistic of 10.60.
- On average, one rank higher (i.e lower average test scores) relative to other zip codes seems associated with 1.72 higher gunshot injuries.